Abstract
We describe an approach to identify patient-specific mechanisms of drug resistance in multiple myeloma (MM) patients through a combination of ex vivo chemosensitivity assay using fresh primary samples and gene set enrichment analysis from RNA-Seq and microarray gene expression profiles.
Methods: We have performed RNA-Seq on 522 primary MM samples and used a combination of dimensionality reduction analysis (t-SNE) and clustering (fuzzy c-means) to group co-expressing genes in clusters, putatively under control of shared regulatory mechanisms. A data set of microarray gene expression from a second cohort of 762 primary MM samples was used to validate the topology of co-expressing clusters obtained from RNA-Seq.
In addition, we have tested drug sensitivity of primary MM samples in an ex vivo reconstruction of the bone marrow tumor microenvironment, including primary human stroma, extra-cellular matrix, and patient-derived soluble factors. 312 of the aforementioned samples were screened against a panel of 95 drugs relevant to MM biology, including PIs -bortezomib (V), carfilzomib (K) and ixazomib (I)-, IMIDs -pomalidomide (P), lenalidomide (R)-, and other standard of care drugs -melphalan (M), dexamethasone (D), doxorubicin (Do), panobinostat (Pa), quisinostat (Q)- and experimental agents -e.g. kinase inhibitors (PKIs), CRM1 inhibitor KPT-330 (Kp) and BCL2 inhibitor ABT-199.
Geneset enrichment analysis was performed using GSEA both agnostically, using the clusters of co-expressing genes, and in a knowledge-driven fashion, using pre-established genesets (KEGG, BIOCARTA, HALLMARKS and REACTOME) using LD50 (@96h) or area under the curve (AUC, 0h-96h) as measures of ex vivo drug resistance, and Spearman correlation as ranking metric.
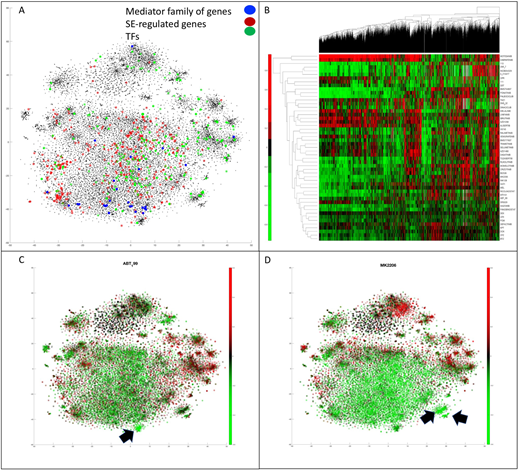
Results: We have identified: (a) MM-specific gene expression regulatory architecture, consisting of multiple clusters of co-expressing genes, "gravitating" around a cloud of more loosely correlated genes enriched for super enhancers and the mediator family of genes (Figure 1a); (b) clusters of genes differentially-expressed in ex vivo drug resistant primary samples, confirming that similar mechanisms of resistance were observed for drugs with similar mechanism of action (e.g. Figure 1b); (c) patient and drug-specific mechanisms of resistance (MOR) to therapy, and thus putative means of re-sensitization; and (d) offered candidate synergistic drug combinations based on mutually exclusive mechanisms of resistance.
As proof of principle, here we discuss MOR observed in two drugs: ABT-199 and MK2206 (Akt inhibitor). The analysis conducted in MM samples tested with ABT-199 agreed with previous clinical studies in MM, pointing to over-expression of Bcl-xl and Mcl1, as well as under-expression of Bim, Bcl-2, and NOXA in resistant samples. A particular gene cluster, significantly underexpressed in ABT-199-resistant samples, was enriched for ribosomal subunits, regulated by, and contained, MYC, suggesting that MYC and ribogenesis may be linked to Bcl-2 inhibition resistance (Figure 1c).
Ex vivo resistance to MK2206 led to ~2/3 of genome under-expression, with the most significant clusters linked to cell cycle (e.g. PLK1, CDK1, CHEK1, etc.) and histone subunits, suggesting a quiescence-mediated mechanism of resistance to Akt inhibition (Figure 1d), in addition to under-expression of AKT, BAD, FOXO and BIM.
Importantly, our analysis has observed significant inter-patient heterogeneity, confirming that multiple MOR can be observed within a patient cohort, reinforcing the need for patient-specific molecular analysis of the disease for choice of therapy.
Figure 1 legend. (a) tSNE clustering of ~22,000 genes according to co-expression within a cohort of 522 primary MM samples, as per RNA-Seq (one black dot per gene). Blue disks represent genes from the mediator complex family, red disks represent super-enhancer regulated genes, and green disks are genes coding for transcription factors. (b) Clustergram representing Spearman correlation between expression of ~22,000 and ex vivo resistance to 43 different drugs. Red stands for direct correlation (high expression in resistance), green for inverse (low expression in resistance). (c and d) tSNE clustering of genes colored according to individual Spearman correlation between gene expression and resistance to ABT-199 and MK2206, respectively. Arrows point to clusters highest related to resistance.
No relevant conflicts of interest to declare.
Author notes
Asterisk with author names denotes non-ASH members.


This feature is available to Subscribers Only
Sign In or Create an Account Close Modal